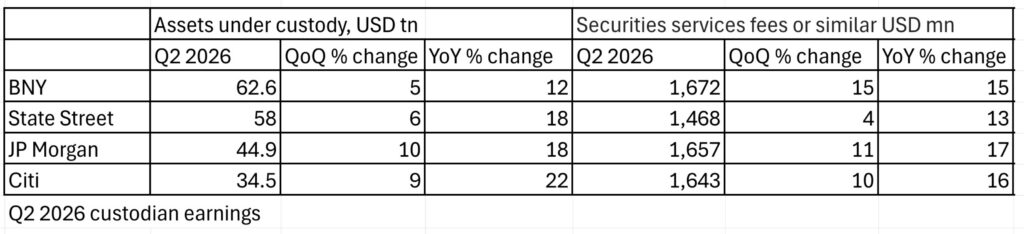










Four of the major global custodians reported last week, with all four posting double-digit year-on-year growth in assets under custody in Q2 2026 as market levels held firm through the quarter. Fee revenues also strengthened across the board, with BNY and Citi both posting their strongest year-on-year gains of the last two quarters.
Market leader BNY closed the quarter with $62.6 trillion in assets under custody and/or administration, up 5% on the previous quarter and 12% year-on-year. Total revenue reached $2,828 million, up 15% year-on-year, with investment services fees also up 15%. Within that, Asset Servicing fees rose 12%, reflecting higher client activity and market values, while Issuer Services fees jumped 23% on stronger Corporate Trust fees. Foreign exchange revenue and net interest income each grew 16% year-on-year.
State Street’s Investment Servicing AUC/A rose 6% quarter-on-quarter and 18% year-on-year to $58 trillion, mainly on higher market levels, flows and net new business. Servicing fee revenue of $1,468 million was up 4% sequentially and 13% year-on-year. New servicing wins in the quarter totalled $87 million in fee revenue, primarily from back office and alternatives mandates, alongside $384 billion in new AUC/A wins, with the majority coming from asset managers and alternatives. A further $335 million in servicing fee revenue and $2.9 trillion in AUC/A remained in the pipeline for future installation at quarter-end.
JP Morgan reported $44.9 trillion in AUC, up 10% on the prior quarter and 18% year-on-year. Securities Services revenue of $1.7 billion was up 17% year-on-year, which the bank attributed predominantly to fee growth on higher market levels and client activity, alongside higher deposit balances.
Citi’s AUC/A climbed to $34.5 trillion, up 9% quarter-on-quarter and 22% year-on-year. Securities Services revenues of $1.6 billion were up 16% year-on-year, driven by a 21% increase in non-interest revenue and a 10% increase in net interest income. Citi said the non-interest revenue gain was primarily driven by higher fees benefiting from the rise in AUC/A, which includes both market valuations and new assets onboarded, while the net interest income increase reflected higher average deposit balances, partially offset by lower deposit spreads.